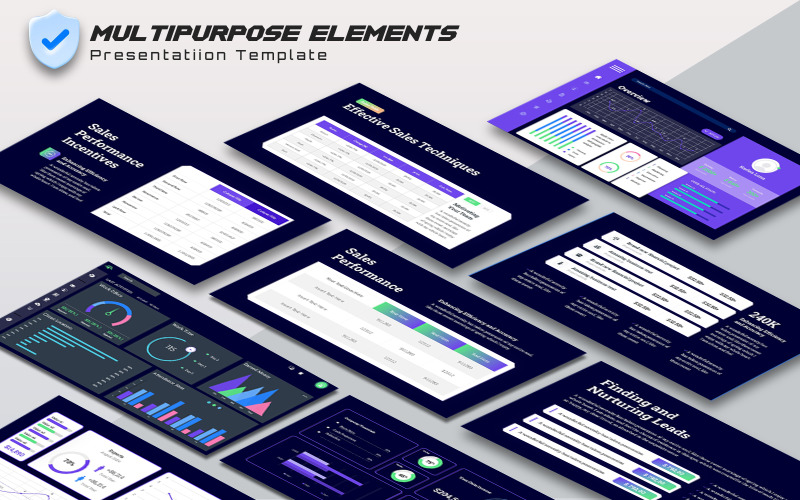
Multipurpose Elements Table and Chart Template
Figures and Tables
Visual elements such as graphs, charts, tables, photographs, diagrams, and maps capture your readers’ attention and help them to understand your ideas more fully. They are like the illustrations that help tell the story. These visuals help to augment your written ideas and simplify complicated textual descriptions. They can help the reader understand a complicated process or visualize trends in the data. The key concept to remember here is that visuals clarify, illustrate, and augment your written text; they are not a replacement for written text. The old adage, “a picture is worth a thousand words” does not hold true in technical writing, but adding visuals may save you a hundred words or so of additional explanation and clarification. If you have visual elements in your document, they must be based on and supplement your written content. Throwing in “gratuitous graphics” just to decorate or take up space can confuse your reader.
Exclusive Features:
16×9 FULL HD Ratio (1920×1080px)
Theme color option
Bonus Included: 4000+ Vector Icons as shapes
Based on Master Slides
Easy and Fully Editable in Powerpoint Presentation
Easy Drag and Drop to change picture
All Graphic Resizable and Editable
Free Font Used
Free and Fast Support
Images used in the demos included.
0 Reviews for this product
0 Comments for this product
